Can I manipulate digitals via scripting without using an address? I want to use just one IO to get the data then toggle a digital tag so it will plot as a digital. This device rapidly toggles between modes(0-11 above) which changes the value of the single register(450058, My whole goal is to create a timing chart of the modes on the trend plot like shown. These are digital IO tags for other status points I am monitoring but it shows what I am trying to accomplish, thanks.
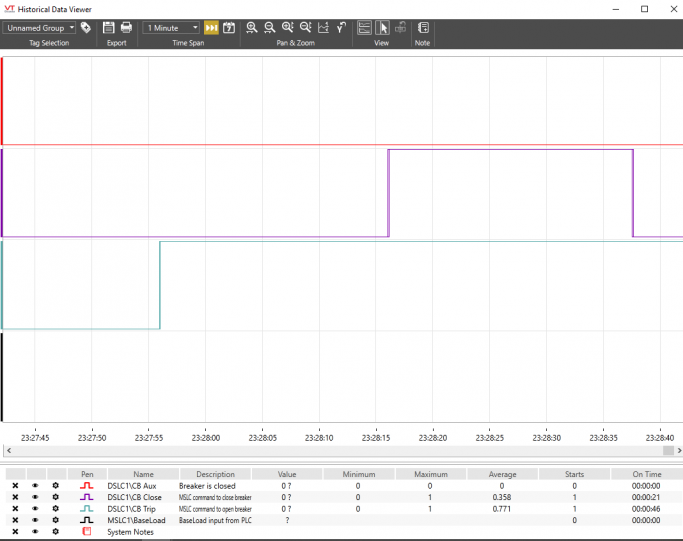
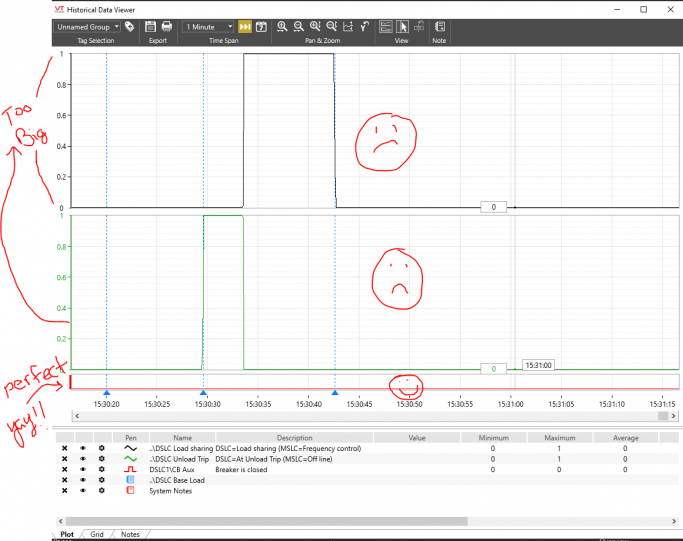
Yes, that makes perfect sense and is how I am configured, however my issue is not obtaining the data and I am not using any graphical widgets. My focus is strictly on the Historical Data Viewer(HDV) and my dilemma is how they are displayed in the HDV. I want to be able to track all the binary states in the HDV so I can quickly tell which on is on by showing them as a digital type. The digital stack nice and compactly on top one another and gives me a quick indication . However, using the method above defaults the tags to an analog type which provides a "large" Y axis scale that takes up too much space. Two questions, 1) can I assign a digital tag type via script(or other method) using the value of the numerical calculation tag above? Or 2) is there a way to remove/condense the Y axis of the individual analog graphs to save space? I have adjusted everything I can find on the Y axis but no luck. See screenshot below to clarify what I am looking for, Thank you for all your support!!
Can I manipulate digitals via scripting without using an address? I want to use just one IO to get the data then toggle a digital tag so it will plot as a digital. This device rapidly toggles between modes(0-11 above) which changes the value of the single register(450058, My whole goal is to create a timing chart of the modes on the trend plot like shown. These are digital IO tags for other status points I am monitoring but it shows what I am trying to accomplish, thanks.

Yes, that makes perfect sense and is how I am configured, however my issue is not obtaining the data and I am not using any graphical widgets. My focus is strictly on the Historical Data Viewer(HDV) and my dilemma is how they are displayed in the HDV. I want to be able to track all the binary states in the HDV so I can quickly tell which on is on by showing them as a digital type. The digital stack nice and compactly on top one another and gives me a quick indication . However, using the method above defaults the tags to an analog type which provides a "large" Y axis scale that takes up too much space. Two questions, 1) can I assign a digital tag type via script(or other method) using the value of the numerical calculation tag above? Or 2) is there a way to remove/condense the Y axis of the individual analog graphs to save space? I have adjusted everything I can find on the Y axis but no luck. See screenshot below to clarify what I am looking for, Thank you for all your support!!
